They say a picture can be worth one-thousand words. In this case, however, it might be worth far more in summarizing the practical impact of the thousands of pages of regulatory text issued by the Environmental Protection Agency (EPA) to set forth and support its final carbon regulations for electric power plants. While we have asserted that the EPA’s recently finalized carbon rules will increase electricity costs for businesses and consumers, impose tens of billions in annual compliance costs, and reduce our nation's global competitiveness, we may not have had a clear picture of the winning and losing states from the EPA’s top-to-bottom reconfiguration of our electricity system … until now.
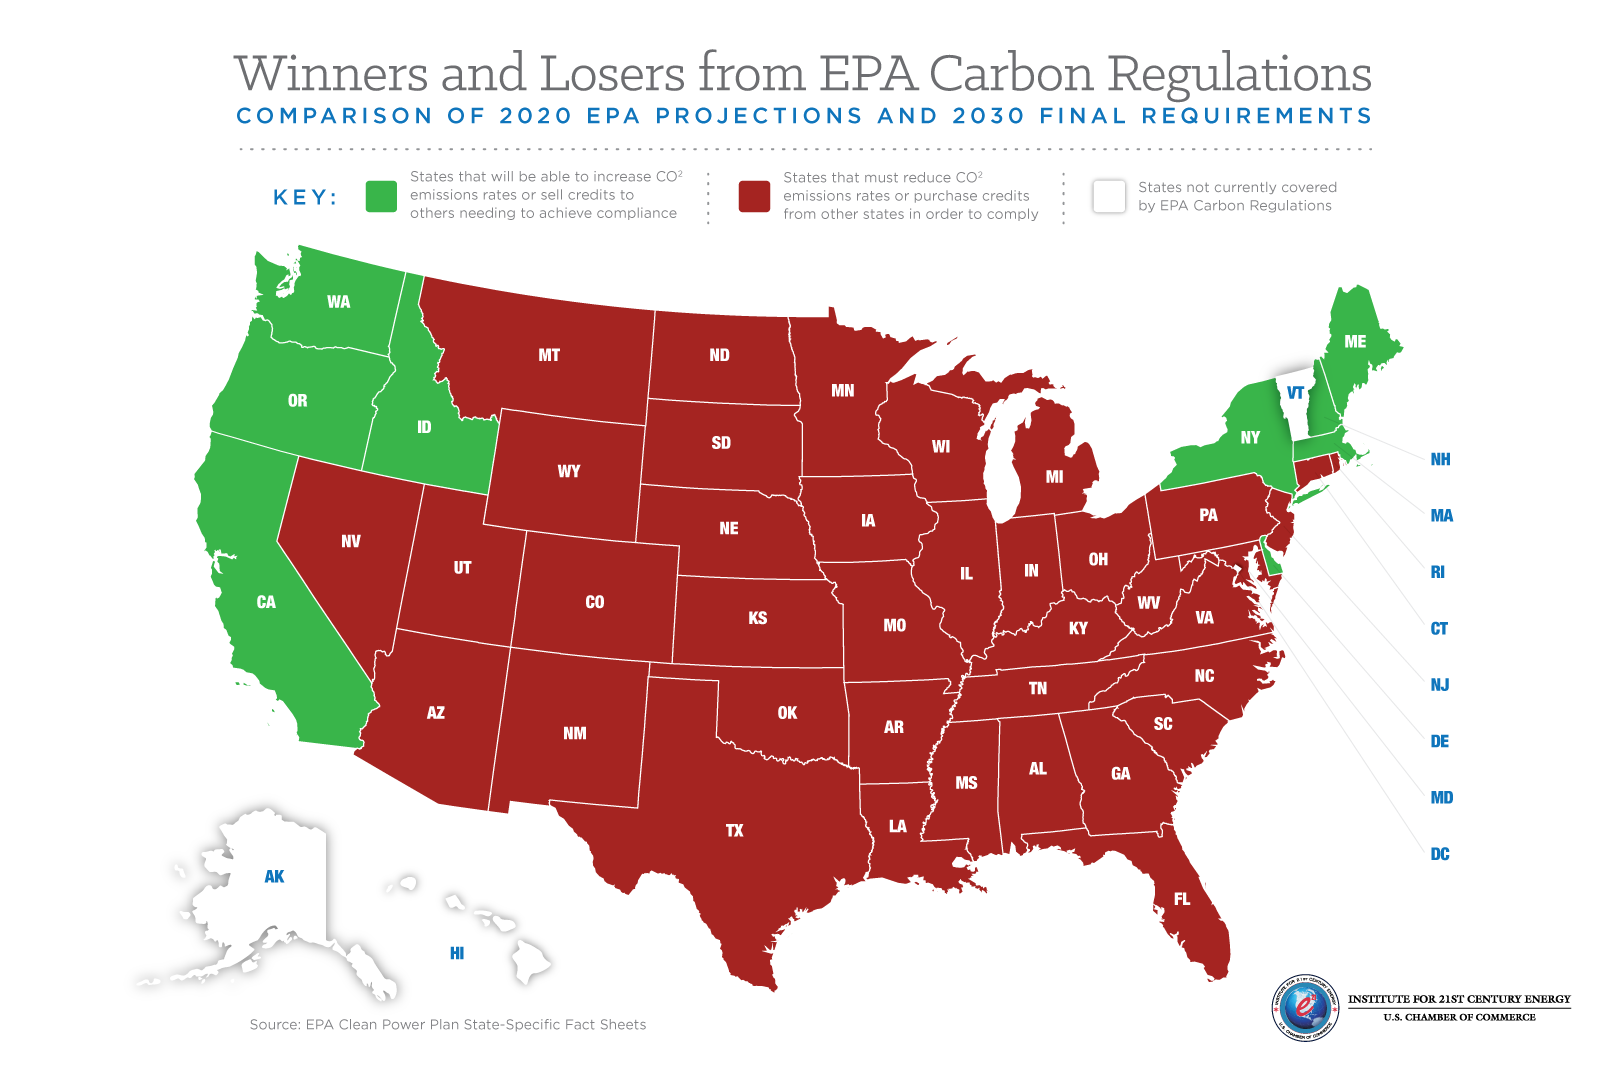
Using the EPA’s state-specific fact sheets accompanying its carbon regulations, and the EPA’s 2020 base case emissions rate projections set forth therein, we are able to get a sense of which states lose under the EPA’s carbon regulations, and which states stand to gain. We did so by tracking the emissions rate reductions that would be necessary under the EPA’s plan in each state from 2020 through 2030. Not surprisingly, our analysis found many more losers than winners. But these figures also reveal an intriguing image showing the geographic split among those winners and losers.
Based on EPA’s own projections, nine states are actually permitted to increase their emissions rates from 2020 to 2030 while still achieving compliance with the agency’s carbon mandate. How can this be if the aim of the EPA’s rulemaking is solely to reduce carbon emissions from the United States power sector? Is redistribution a concurrent goal of the EPA’s unprecedented regulatory regime, or just a coincidental outcome of complicated formulas and difficult projections?
Pursuant to the federal plan accompanying its carbon regulations, the EPA sets forth two alternative compliance pathways: “a rate-based emissions trading program and a mass-based emissions trading program.” Thus, the EPA is coercing states to trade credits – a la cap and trade – in order to comply with its carbon emissions mandates. While rate- and mass-based projections and requirements vary slightly, the states that are assigned easier lifts in either circumstance may act as credit “banks” while the more numerous “debtor” states are saddled with challenging emissions reduction targets.
As a practical matter, what does this mean? For starters, creditor states will face reduced pressure to shut down affordable gas- and coal-powered electricity, thereby lessening the impact of the electricity price spikes expected from the rule. The ability to increase emissions rates will allow economic development to proceed with fewer restrictions, while states with strict targets are forced to curtail affordable energy in order to remain in good standing with the electricity overlords at the EPA. And for states that enter into cap-and-trade regimes (the EPA’s heavily preferred compliance path), those allowed to increase carbon emissions can opt to sell credits to losing states, effectively cashing checks on the backs of states with steeper emissions reduction mandates.
For example, between 2020 and 2030, EPA’s final rule allows Oregon to increase carbon emissions by 3.1 million tons of CO2 annually—a whopping 63% jump. If the state so chooses, it could monetize that allowance which, at a reasonably expected price of $40 per ton, could provide the state of Oregon $125 million in annual revenue—paid for by losing states seeking to comply with the EPA’s regulatory mandate.
It is also interesting to note that the states that are permitted to increase emissions rates happen to currently endure some of the highest electricity prices in the country. In fact, states such as those in New England, along with California and New York, are transformed from electricity price “losers” under their own restrictive state policies into EPA-imposed cap-and-trade “winners.” Viewed another way, the EPA’s rule will effectively nationalize the exorbitant electricity rates and cap-and-trade economies of the West Coast and Northeast, and force the rest of the country to foot the bill for those policies.
The story that this graphic unmistakably projects is one where the EPA is not solely looking to reduce carbon dioxide emissions. Instead, the EPA has picked winners and losers by imposing a system that will drive up prices in low-cost electricity states and redistribute the revenues associated with those higher prices to select West Coast and Northeast states. Whether a direct objective of the regulation or a coincidental outcome, these disparities shine light on the inherent unfairness of the EPA’s scheme, and ought to set off warning bells in the many states dealt the short end of the stick.